

 Track2Realty: At nearly US$160 per sq. ft. per annum, Delhi’s Central Business District (CBD) of Connaught Place was ranked as the sixth most expensive prime office market in the world, according to CBRE’s semi-annual Global Prime Office Occupancy Costs survey. Mumbai’s alternative business district of Bandra–Kurla Complex (BKC) remained at the sixteenth, and its CBD of Nariman Point at the thirty-second positions on the Top 50 rankings for global prime office properties.
London’s West End remained the world’s highest-priced office market, but Asia continued to dominate the world’s most expensive office locations, accounting for three of the top five markets.
London West End’s overall prime occupancy costs of US$274 per sq. ft. per year topped the “most expensive” list. Hong Kong Central followed with total prime occupancy costs of US$251 per sq. ft., Beijing’s Finance Street (US$198 per sq. ft.), Beijing’s Central Business District (CBD) (US$189 per sq. ft.) and Moscow (US$165 per sq. ft.) rounded out the top five.
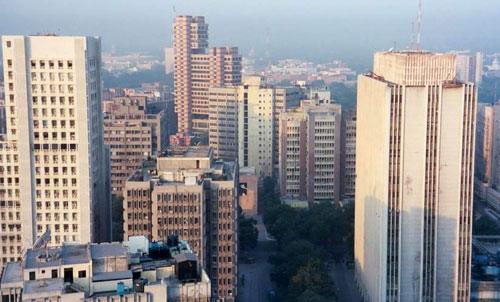
Commenting on the findings of the survey, Anshuman Magazine, CMD, CBRE South Asia said, “Although New Delhi’s Connaught Place moved up two places to the sixth spot on the global top 10 rankings over Q1 2014, annual occupancy costs here remained stable because of Rupee appreciation since the first quarter. I have to add that the Capital has seen a strong leasing environment amid limited availability and shortage of new corporate real estate spaces. Office occupiers from the financial services and media sectors dominated commercial space transactions during the year.”
Connaught Place remains a highly sought after destination for corporate office occupiers, because of its central location and connectivity to the rest of the city. During the review period, annual office occupancy costs in Gurgaon too remained stable; while that of Nariman Point dropped by about 2% and BKC by about 6%. Meanwhile, Bangalore’s Central Business District, which saw a nearly 9% drop, was among the top five global prime office markets to witness a decrease in yearly occupancy costs.
The change in prime office occupancy costs since CBRE’s last survey in June mirrored the gradual, multi-speed recovery of the global economy. Global prime office occupancy costs rose 2.5 percent year-over-year, led by the Americas (up 4.1 percent) and Asia Pacific (up 2.8 percent). Meanwhile, the regional realty market of Europe, the Middle East and Africa (EMEA) was essentially flat, edging up 0.3 percent year-over-year.
“We expect the gradual recovery of the global economy to continue, leading to better hiring rates and further reduction in the availability of space across most markets over the near term,” said Richard Barkham, Global Chief Economist, CBRE. “In this environment, we expect occupancy costs to continue rising from current levels, further limiting options for occupiers. Technology, quality and flexibility are expected to increasingly come into consideration in space use and location decisions, as occupiers will seek to contain costs and improve productivity.”
CBRE tracks occupancy costs for prime office space in 126 markets around the globe. Of the top 50 “most expensive” markets, 20 were in EMEA, 20 were in Asia Pacific and 10 were in the Americas.
Europe, Middle East & Africa (EMEA)
The Eurozone’s tepid economic recovery has held back occupier activity, resulting in static prime occupancy costs in most core European markets. The region’s 0.3 percent year-over-year increase in prime occupancy costs was primarily driven by buoyant conditions in U.K. cities, most Nordic markets, and the strong recovery of the Dublin office market. The main decreases have been in central European markets, such as Warsaw (down 1.6 percent), where the economies are relatively healthy but new supply has driven down rents. In only a few markets, notably Dublin (up 34.9 percent) and London, a robust recovery in occupier demand coincided with a lack of new supply.
In addition to London West End, other markets from the region on the global top 10 list were Moscow (US$165 per sq. ft.) and London City (US$153 per sq. ft.).
Asia Pacific
Asia Pacific had 20 markets ranked in the top 50 most expensive, including seven of the top 10—Hong Kong (Central), Beijing (Finance Street), Beijing (CBD), New Delhi (Connaught Place – CBD), Hong Kong (West Kowloon), Tokyo (Marunouchi Otemachi) and Shanghai (Pudong). Occupier activity in the region was largely driven by domestic corporations and companies in the technology, media and telecommunications sectors. Half the markets saw costs increase above 1 percent.
Hong Kong (Central) remained the only market in the world—other than London’s West End—with a prime occupancy cost exceeding $200 per sq. ft.
The most expensive market in the global ranking from the Pacific Region was Sydney (US$99 per sq. ft.), in 19thplace.
Americas
In the U.S., where the economic recovery has firmly taken hold, strong leasing activity led to the highest level of quarterly net absorption since 2007, driving above-inflation increases in prime occupancy costs across all but one major U.S. market. Additionally, increasingly broad-based rising hiring rates have boosted demand for office space.
Eight North American markets recorded double-digit increases in prime occupancy costs in Q3 2014, and the top six growth markets in the Americas were all U.S. cities.
New York Midtown, the 11th most expensive market in the world, remained the most expensive Americas market, with a prime office occupancy cost of US$121 per sq. ft.
Rio de Janeiro remained the most expensive market in Latin America, posting an office occupancy cost of US$101 per sq. ft. and ranking as the 18th most expensive market globally.
Top 10
Most Expensive Markets
(In US$ per sq. ft. per annum)
| Rank | Market | Occ. Cost |
| 1 | London West End, United Kingdom | 273.63 |
| 2 | Hong Kong (Central), Hong Kong | 250.61 |
| 3 | Beijing (Finance Street), China | 197.75 |
| 4 | Beijing (CBD), China | 189.39 |
| 5 | Moscow, Russian Federation | 165.05 |
| 6 | New Delhi (Connaught Place – CBD), India | 158.47 |
| 7 | Hong Kong (West Kowloon), Hong Kong | 153.65 |
| 8 | London City, United Kingdom | 152.67 |
| 9 | Tokyo (Marunouchi Otemachi), Japan | 136.46 |
| 10 | Shanghai (Pudong), China | 127.89 |
Largest Annual Changes
Occupancy Costs
(In local currency and measure)
Top 5 Increases
| Rank | Market | % Change |
| 1 | Dublin, Ireland | 34.9 |
| 2 | Manila, Philippines | 20.7 |
| 3 | Seattle (Suburban), U.S. | 20.5 |
| 4 | Kuala Lumpur, Malaysia | 16.7 |
| 5 | Singapore, Singapore | 16.5 |
Top 5 Decreases
| Rank | Market | % Change |
| 1 | Santiago, Chile | -13.5 |
| 2 | Lyon, France | -10.8 |
| 3 | Hong Kong (West Kowloon), Hong Kong | -9.8 |
| 4 | Bangalore (CBD), India | -8.5 |
| 5 | Palma de Mallorca, Spain | -7.8 |
Top 50 Most Expensive Office Markets
(In US$ per sq. ft. per annum)
| Rank (Q3 2014) | Market | Occ. Cost | Rank (Q1 2014) |
| 1 | London West End, United Kingdom | 273.63 | 1 |
| 2 | Hong Kong (Central), Hong Kong | 250.61 | 2 |
| 3 | Beijing (Finance Street), China | 197.75 | 3 |
| 4 | Beijing (CBD), China | 189.39 | 4 |
| 5 | Moscow, Russian Federation | 165.05 | 5 |
| 6 | New Delhi (Connaught Place – CBD), India | 158.47 | 8 |
| 7 | Hong Kong (West Kowloon), Hong Kong | 153.65 | 6 |
| 8 | London City, United Kingdom | 152.67 | 7 |
| 9 | Tokyo (Marunouchi Otemachi), Japan | 136.46 | 9 |
| 10 | Shanghai (Pudong), China | 127.89 | 12 |
| 11 | New York (Midtown Manhattan), U.S. | 120.65 | 11 |
| 12 | San Francisco (Downtown), U.S. | 114.00 | 15 |
| 13 | Paris, France | 113.95 | 10 |
| 14 | Singapore, Singapore | 112.91 | 18 |
| 15 | Shanghai (Puxi), China | 112.14 | 14 |
| 16 | Mumbai (Bandra Kurla Complex), India | 103.52 | 16 |
| 17 | Seoul (CBD), South Korea | 102.55 | 20 |
| 18 | Rio de Janeiro, Brazil | 101.34 | 13 |
| 19 | Sydney, Australia | 99.06 | 17 |
| 20 | Boston (Downtown), U.S. | 96.25 | 22 |
| 21 | Geneva, Switzerland | 93.83 | 19 |
| 22 | Seoul (Yeouido), South Korea | 92.84 | 24 |
| 23 | Dubai, United Arab Emirates | 92.56 | 23 |
| 24 | São Paulo, Brazil | 91.78 | 21 |
| 25 | Washington, D.C. (Downtown), U.S. | 87.61 | 26 |
| 26 | Zurich, Switzerland | 84.10 | 25 |
| 27 | Los Angeles (Suburban), U.S. | 83.62 | 30 |
| 28 | New York (Downtown Manhattan), U.S. | 82.55 | 29 |
| 29 | Jakarta, Indonesia | 81.81 | 31 |
| 30 | Istanbul, Turkey | 81.44 | 28 |
| 31 | Perth, Australia | 77.02 | 27 |
| 32 | Mumbai (Nariman Point – CBD), India | 76.57 | 32 |
| 33 | Edinburgh, United Kingdom | 73.76 | 34 |
| 34 | Aberdeen, United Kingdom | 73.35 | 35 |
| 35 | Manchester, United Kingdom | 73.35 | 36 |
| 36 | Guangzhou, China | 73.21 | 38 |
| 37 | Dublin, Ireland | 73.00 | 48 |
| 38 | San Francisco (Peninsula), U.S. | 72.57 | 46 |
| 39 | Birmingham, United Kingdom | 71.32 | 39 |
| 40 | Stockholm, Sweden | 70.88 | 33 |
| 41 | Bristol, United Kingdom | 70.51 | 40 |
| 42 | Glasgow, United Kingdom | 70.51 | 45 |
| 43 | Oslo, Norway | 68.30 | 44 |
| 44 | Taipei, Taiwan | 67.99 | 47 |
| 45 | Milan, Italy | 67.71 | 37 |
| 46 | Brisbane, Australia | 67.43 | 43 |
| 47 | Leeds, United Kingdom | 65.65 | 49 |
| 48 | Ho Chi Minh City, Vietnam | 65.35 | 42 |
| 49 | Frankfurt, Germany | 65.12 | 41 |
| 50 | Mexico City, Mexico | 62.48 | 51 |
Source: CBRE Global Research and Consulting, Q3 2014.


